![A Simulation Of Hurricane Katrina Gaining Strength[VIDEO]](http://townsquare.media/site/149/files/2012/01/Katrina-300x145.jpg?w=980&q=75)
A Simulation Of Hurricane Katrina Gaining Strength[VIDEO]
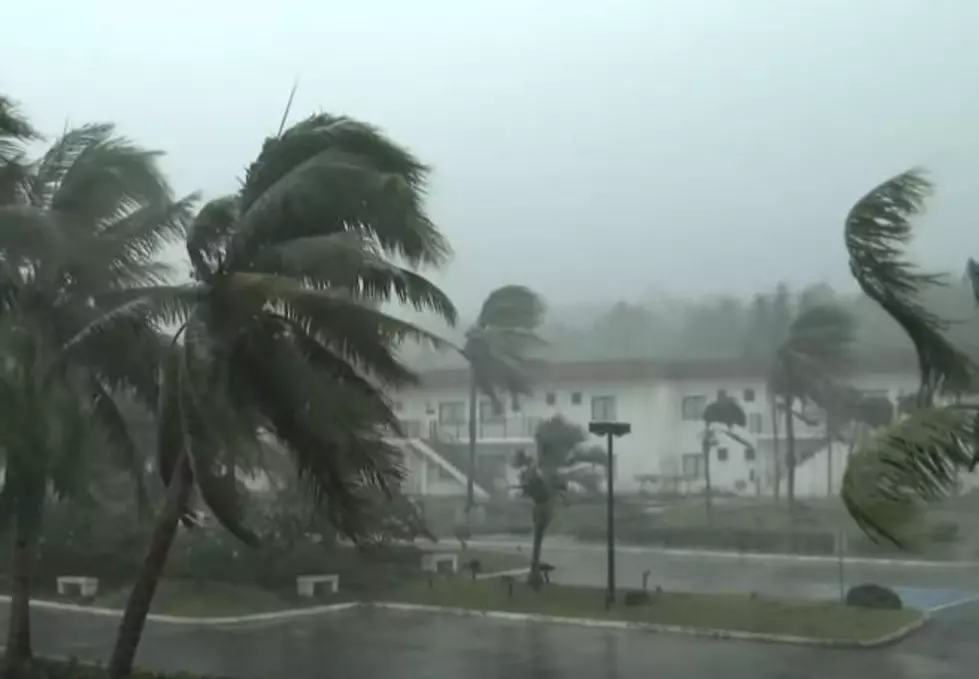
Hurricane Katrina is the Hurricane Audry of my generation. Growing up in SWLA we have always heard that New Orleans is like a fish bowl and would be under water if the conditions were right. Well, in August and September of 2005 the bottom fell out and we all know the rest of the story.
Scientists at the Advanced Visualization Laboratory at the National Center for Supercomputing Applications gathered information from the National Center for Atmospheric Research in Boulder, Colorado and created an eye-catching simulation that shows the storm over a period of a day and a half as it gathered strength.
The colored lines trace the storm's 150 mph winds and represent air rising(the yellow lines) and falling(the blue lines).
As the storm progresses, the sun, moon, and stars come into view and change positions.
The video is from a film called Dynamic Earth which explores how the Earth's climate works.
Let's just hope and pray that the levees in the New Orleans area work the next time!
More From Gator 99.5


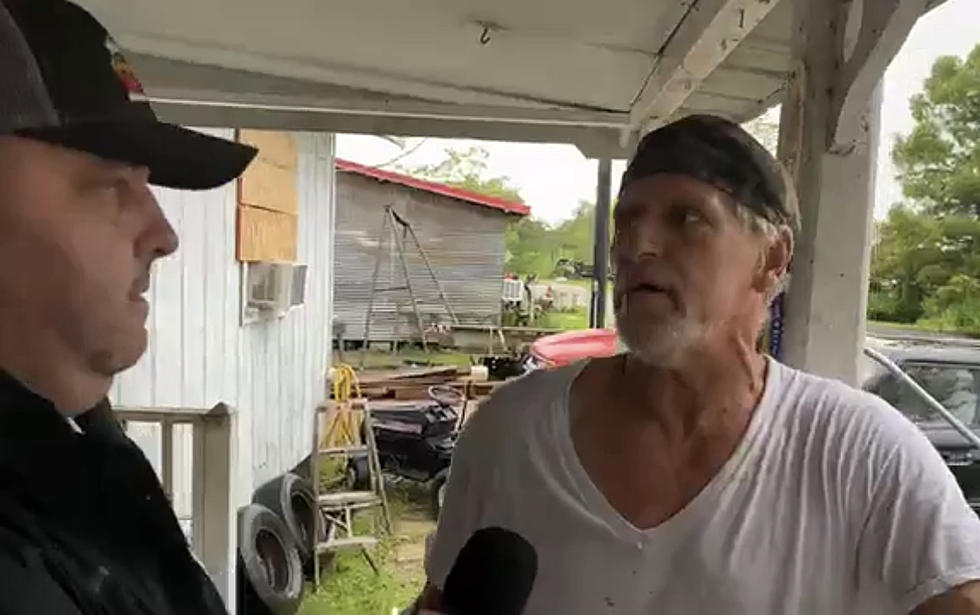
![LIVE Footage From Grand Isle as Hurricane Ida Approaches [WATCH]](http://townsquare.media/site/34/files/2021/08/attachment-Screen-Shot-2021-08-29-at-11.36.19-AM.jpg?w=980&q=75)
